Discover how Preprocess templates are used in projects to create Excel formulas, charts and graphs that can be merged into Document Templates.
Pre-process templates are Excel spreadsheets that process your data before merging it into the final generated document. You can run calculations and functions on your data, create charts and graphs, named ranges and tables and then use the calculated values as content in your document templates. This page will describe how you create these templates and link them to your project and your Word document templates.
Fundamentals
You might already be using Excel in your business processes, perhaps copying data into cells on an input sheet that are then used in other sheets, in formulas & calculations or to generate charts and graphs. You might then be manually copying and pasting those values into a Word document, formatting them to match the style of your document. MergeOS makes this an automated process, removing the need for you to manually do the copying and pasting.
You can think of a pre-process template as a function that takes an input and produces an output. The input is the current row of data (and any related data) that your MergeOS project is processing, the Excel spreadsheet is the function and the output is the named ranges, tables and charts within the spreadsheet.
You can use any Excel spreadsheet that you already use in your business as a pre-process template. You just need to make some small changes to hook it all up, using a simple naming convention for Excel named ranges you can connect a spreadsheet in just a few minutes.
Merging Data Into Excel
There are two ways that you can merge data into your Excel pre-process template. The first is used to merge data into a single cell using Input Named Ranges, the other will merge data from a related table into an Excel Table.
Input Named Ranges
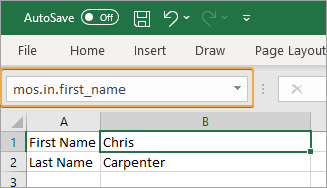
The first step in setting up your spreadsheet is to configure the Input Named Ranges. MergeOS uses a special naming convention that tells your project which cells in the spreadsheet can accept data. When you name the cells in your spreadsheet this way, MergeOS will read them when you upload the spreadsheet to a project, and allow you to map the columns from your data table to those cells.
mos.in.use_a_descriptive_name
An Input Named Range in Excel
Input Named Range Conventions
The named range must start with mos.in. and then contain one or more words
When we show the cell name within MergeOS, we remove the underscores and capitalise the words. So, mos.in.first_name becomes First Name when you see it on the project screen
Input Named Ranges must only reference one cell. MergeOS will not understand a named range that spans multiple rows or columns.
Merging data into an Excel Table
When the data table in your project has a one-to-many relationship with another data table, you can link the related table to an Excel table, and MergeOS will merge all the related data into the Excel table. If you just read that sentence and are now scratching your head in confusion, take a look at the Understanding Data Tables article which explains how related tables work.
To set this up in your Excel pre-process template, you just need to create a standard Excel Table and name it.
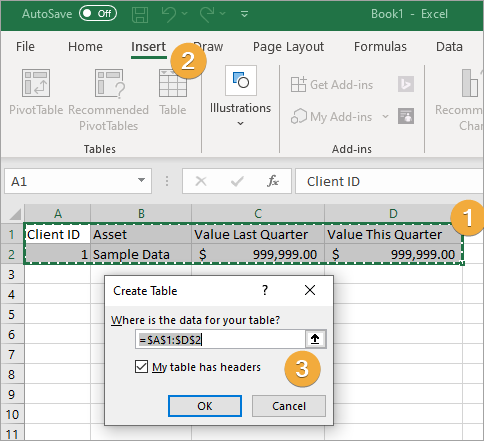
Creating an Excel Table
Enter the column headings for your table into Excel and then select the headings and the first row. We've entered some mock data into the first row, as this tells MergeOS what type of data to expect for each column, such as numbers or text.
Select the Insert tab, and then click Table
In the Create Table dialog, ensure that My table has headers is checked, then click OK
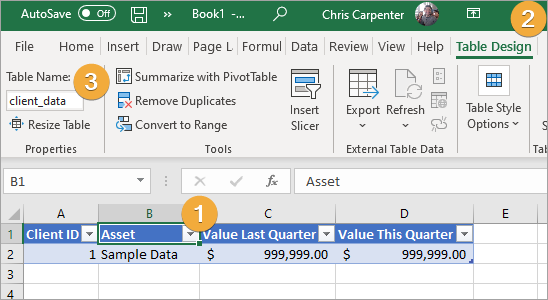
Now just name the table in Excel:
Naming the Excel Table
Click to select any cell within the table
Click on the Table Design menu item
Enter a name for your table. MergeOS will replace underscores ( _ ) with spaces and capitalise the words.
Mapping a related table to an Excel Table
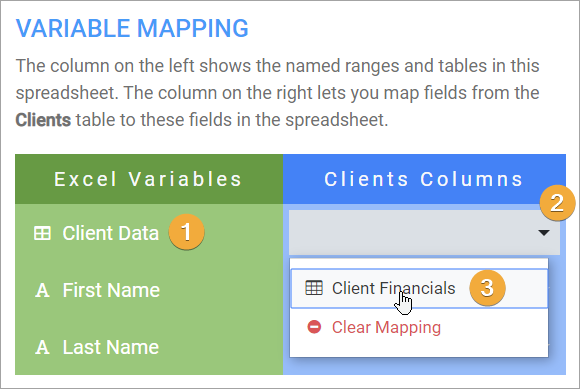
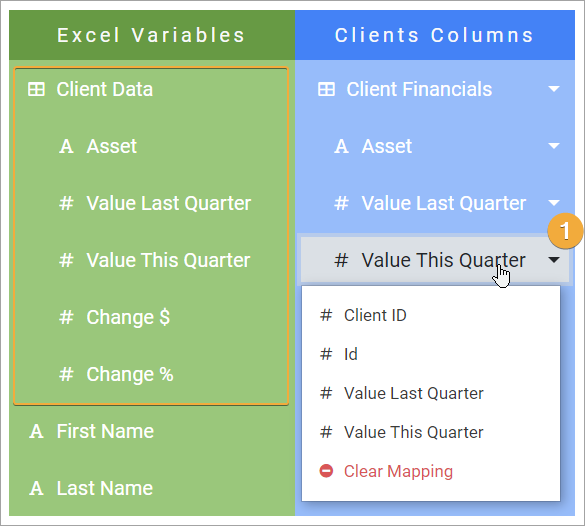
When you upload an Excel pre-process template to your project, MergeOS will scan it for any Excel Tables and show them in the Variable Mapping section of the Pre-process step in your project. You can then map each column in the Excel table to columns in the related table, using the drop down on the right.
Mapping an Excel Table to a MergeOS Related Table
The Excel Table will display on the left, in the Excel Variables column. The name is the same as what you called it in Excel, without the underscores.
Select the drop down on the right to display all the related data tables
Choose the related data table you would like to map to this Excel Table
After choosing the related data table, the columns within the Excel Table will display, and you can now map those to the columns within the related data table.
Mapping Related Columns
Click on each of the rows and choose the column on the right. When the project is running, it will merge data from that column in the related table to the matching column in the Excel spreadsheet.
Using Formulas in Excel Tables
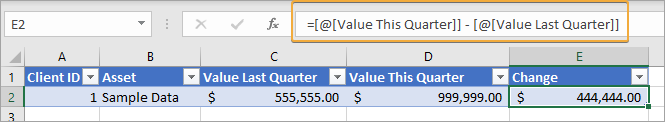
Not every column in the Excel Table needs to be mapped to a column in the related table. You can add table formulas to Excel table columns using Structured References:
Structured References in an Excel Table If you don't map a column then MergeOS will keep the formula and as the other columns are merged from your related table, the formula calculate as normal. You can then use that value in your Document Template.
Getting data out of Excel
There are a few ways to get the data out of an Excel pre-process template, depending on whether the data is a named range, an Excel table or a chart.
Output Named Ranges
To tell MergeOS which cells you would like to expose and make available to your Document Templates, you just use a specially structured Named Range. These named ranges we call Output Named Ranges, and the syntax is as follows:
mos.out.use_a_descriptive_name
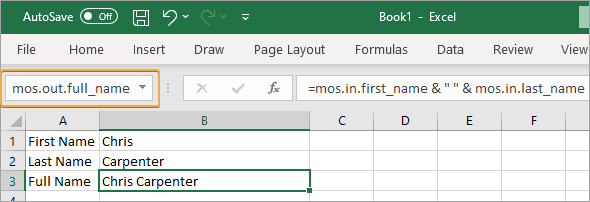
An Output Named Range in Excel The example above shows how we made an Output Named Range in cell B3. Excel will calculate the value of this cell using the formula. Because we named the above range using mos.out. at the beginning, MergeOS will make the value available as a variable to use in a Document Template. You can use the variable in your Word Document Template like this:
{{ ["pre"."full_name"] }}
Note that you don't use the mos.in. part when using the variable in your Word template. However, you must use the "pre". part, as this tells Merge that the variable is coming from a pre-process template, and not a data table.
Charts and Graphs
You can create charts and graphs inside your Excel pre-process templates and use them in your Word Document Templates. This is really powerful when combined with mapping Related Data Tables to Excel Tables and then using that table as the datasource for the chart.
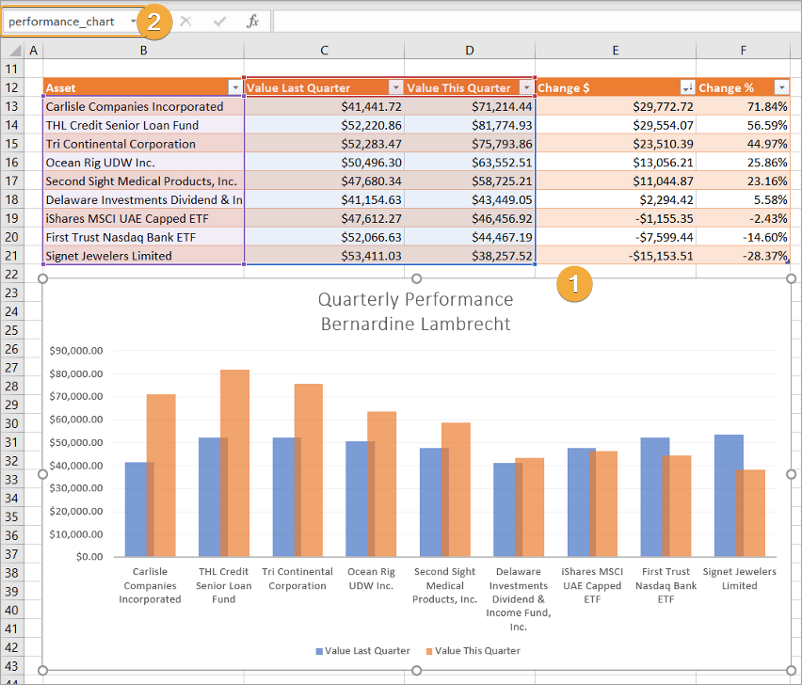
The example below shows a chart that was made with an Excel Table as the datasource. You can format the chart any way you like in Excel. Because you won't have any data in the Excel table the chart is using, it's a good idea to enter example data into it. This lets you see how the chart will look once generated, and MergeOS will remove it before merging in the real data. Naming an Excel Chart
Click on the Chart in Excel
Give the chart a name
This name can now be used in your Document Templates to bring in the generated chart. Charts are inserted into the Word template as images, and you can control the size using the chart function.
You can merge Excel Tables into your Word Document Templates using the name of the table and some a simple placeholder.
Excel Table NameTo get the name of an Excel Table:
Select the table in Excel
Click on the Table Design menu
Copy the name from the Table Name field
Once you have the name of the table, you can use the MergeOS table function in your Word Document Template to merge the table into the generated document:
{{ table( ["pre"."client_table"] ) }}
The table function has a range of extra settings you can use to customise the table that output: